
Lifecharm Shells Redux
September 18, 2012 by Giles Lane · Comments Off on Lifecharm Shells Redux
Our collaborator at Philips R&D in Cambridge, David Walker, was generous enough to have some of the Lifecharm shells fabbed in a range of more exotic materials than our initial prototypes using Shapeways (a 3D printing firm spun-out of Royal Philips Electronics). The materials used range from metal/silver, ceramic and frosted and transparent glass.


Many thanks also to Dipak Mistry, our collaborator on Visualise Lifestreams at Arts & Business Cambridge who dropped them by the studio this morning.
Presenting the Lifecharm shells
August 9, 2012 by stefankueppers · Comments Off on Presenting the Lifecharm shells
This morning we are off to Cambridge for our final meeting with our collaboration partners at Philips R&D, where we will be presenting the lifecharm shells we have generated from our health data and talking about where we will be taking the project next.

Of fly-eye domes and public health data sets
August 8, 2012 by stefankueppers · Comments Off on Of fly-eye domes and public health data sets
This post is one of several exploring the research and creative processes Giles and I have undertaken for our project Lifestreams, an Art+Tech collaboration with industry partner, Philips R&D in Cambridge as part of Anglia Ruskin University’s Visualise programme.
As part of our quest to explore making health data tangible we began to research means of experiencing larger volumes of collective health data as a complementary experience to the ‘lifecharms‘ illustrating individual data streams. We imagined these different strands operating in tandem to provide micro and macro perspectives on how we can forge new relationships to health and wellbeing.
The question immediately arose of how we could achieve meaningful translations of complex health data. Our initial solution was to turn public health data (derived from Network of Public Health Observatories) into varied surface expressions on a larger installation work, allowing a degree of participation from direct public interaction to inform manipulations of the public data sets. To achieve this we thought about the production of manipulated stacking surfaces that would aggregate into a communal structure.
Our idea for manifesting this health data was to take each data set, determine its dimensions (i.e. which and how many data ranges does it have, what do they represent? e.g. mortality rates, obesity, etc.) and take each of these to be the driving parameters of a set number of ways to cut, punch, emboss or bend thin sheets of material, either paper, card or metal. We would then create one layer of material for each data dimension, apply the parameter controlled action for it (ie, print, cut, punch, bend; where and by how much) and do this for each of the data dimensions.

For each dataset (by ward or time span) we would end up with a stack of screens which together would define a unique surface or mask that would be specific in both tactile and visual effect. These stacked screens would make up the facets to be collated into a larger physical structure that would evolve out of the geometry of the base shape and be assembled by members of the audience to ‘collectively grow’ the public health data installation piece.

We proposed to use Buckminster Fuller‘s fly-eye dome as the base for a slightly larger than human size dome structure which would rest on a tripod-like support structure under which visitors could move to look up and in. The fly-eye dome is a design variation on Bucky’s earlier geodesic dome structures lending itself well as a projection structure. We planned to use it to present transformed public health datasets which become layered and patterned masks to produce alternating light and shadows from within the dome surface. Each facet, or mask, would be representative of a specific grouping of public health data, either by time interval or by geographic proximity.

In thinking about how this would work as an installation, we came up with two different projection approaches creating two types of experiences:
- Outward facing masks with switch-able internal illumination creating projections that are cast on the gallery wall interiors and,
- Inward facing masks with with external illumination where the audience steps inside the dome structure manipulating an exterior light source (or ‘sun’) around the dome structure by hand.

A very attractive benefit of collaborating with Philips is their expertise and product range in professional lighting. In particular, Philips has developed a product series and related technologies called LivingColours which we considered to be a good option for the illumination in our fly-eye domes.
Despite developing this concept quite far, we eventually moved away from it as we felt it didn’t encompass enough of a sense of the living and organic processes which we want to engage people in. In many ways we felt it was moving back towards static data visualisations that are too readily ‘readable’ and which soon cease to have the power to engage people in an ongoing and reflective relationship with how public data can be seen as part of the environment in which we exist.
3rd generation of 3D printed Shells for Visualise
August 2, 2012 by stefankueppers · 1 Comment
Our third round of shells fresh out of fabrication is here!

I am excited that we now have shells that are more organic and life-like coming through. To drive this additional complexity I’ve been experimenting with mixing the combinations of data and exploring how these generate more ‘organic’ forms as they are fed into different parameters of the growth grammar.
In my last post I described how I’ve developed a bespoke shell model by programming in JAVA with growth grammars which start out with mathematical principles. These project a spiral onto the surface of a cone in 3D for the primary growth curve. Then I begin to tweak and subvert the surface shape as it grows, adjusting the rhythms and patterning of the data to add a degree of interpretation.
This is very interpretive and not hard science; it is not classic data-visualisation or information graphics. I take sets of health and lifestyle data and make deliberate decisions in how I interpret what kind of ‘expression’ they generate. It is highly designed and crafted process which I am evolving to achieve both an aesthetic outcome, but also one where the data plays a key role that may not be transparent or simply ‘readable’ like a graph, but rather becomes emotive.
This is important and different in that we are trying to produce a sense of meaning that is not read through classic symbols but rather through a tactile and visual experience. The tangible form of the shells embodies rhythm, resonance or dissonance; attraction or repulsion.

What we are attempting is not just a ‘transduction’ of health data into physical form, but a transformation of how we develop relationships with that data and what it means for us. The data is captured and transfigured into the physical form of the shells – producing something which is magical, transformative and which cannot be easily read but is heavy with the potential for meaning. The shells become more like talismans than just static instantiations of data.
This is very different to a technique that just takes data and processes it into a visual or physical form. It is not about numbers but about a model of generating shells that are qualitative, meaning producing and change making. It is about how a person could pick up a shell and begin to read their own meanings into it, knowing that it is generated from their own health data. Knowing that the subtle but strange variations in each shell indicate something to be explored in our lifestyles and behaviours.

This third generation of shells are moving further towards acquiring a ‘life’ of their own, becoming objects of meaning in the world. They are shaped by ‘lived constraints’ in the growth model and are getting expressions that go beyond pure mathematics.
I’m now working on a fourth generation of shells, this time using data posted on the internet using social media.
1st generation of 3D printed Shells for Visualise
July 16, 2012 by stefankueppers · Comments Off on 1st generation of 3D printed Shells for Visualise

After what has been a broad exploratory research and foraging phase into shell morphology and modelling systems for our Visualise project, I have just picked up the first round of 3d printed shells which we had done at the Digital Manufacturing Centre @ UCL. Thanks to Martin and Richard for their assistance with the 3d printing process!
What you see here is a twist on classic plain formula driven generative shells that you may have seen before. We are experimenting with ways of adapting shell formation of our 3d shells based on data capture we have started in previous experiments in lifestyle and health data monitoring. I have been looking into a variety of generative modelling systems anywhere from those originating in the CAD world to those for plant modelling in the bio and agricultural sciences.

Now I have settled on using a growth grammar platform called XL (it builds on ideas of l-systems but with much more flexibility and dynamic rewriting of growth rules). The XL grammar is interesting as its been developed for plant morphological and systemic modelling, allowing the generative growth rules to be switched based on time variant environmental factors throughout growth cycles.
This offers some exciting possibilities of mimicking real-world feedback patterns of environmental constraints on living entities such as plants or other living systems giving rise to different possible ‘expressions’ based on the ‘quality of life’ over time they experience in their environment (e.g. through droughts, wet seasons, sparse or rich nutrition, pollution factors, over-shading, etc.).
The shells you see here are a variations of an evolving shell model that can be infused with our previous and ongoing environmental and personal data capture data sets (e.g. with readings such as daily step-count, blood pressure, sleep pattern regularity) to determine the evolving form.
Look out for further variations on these shells shortly!
We Are All Food Critics – The Reviews
July 6, 2012 by Giles Lane · 1 Comment
One of the most fun things we’ve done this year has to be the little project we ran as part of the Soho Food Feast : helping some of the children of Soho Parish Primary School produce their own reviews of the amazing foods on offer in specially designed eNotebooks. The children would choose something from one of the many stalls, bring it to be photographed and a Polaroid PoGo photo sticker printed out an stuck into one of the eNotebooks, then they’d write about what the dish looked, smelt, felt, sounded and tasted like. This idea of doing the reviews through the 5 senses, along with the great introduction, was contributed by Fay Maschler, the restaurant critic of the London Evening Standard and one of the Food Feast committee members.
We’ve now published a compilation of the best reviews which is available via the Diffusion Library as downloadable eBooks and in the bookreader format. We’re also printing a short run edition which will go the children themselves (and a few for the school to sell to raise funds – get one while you can!). Thanks to everyone who took part in this project – the children of Soho Parish and Soho Youth, members of the Food Feast Committee (Anita Coppins, Wendy Cope, Clare Lynch), Rachel Earnshaw (Head Teacher) and the team here : Mandy Tang, Haz Tagiuri & Stefan Kueppers.
Neighbourhood knowledge in Pallion
July 2, 2012 by Giles Lane · Comments Off on Neighbourhood knowledge in Pallion
Last Thursday I visited members of the Pallion Ideas Exchange (PAGPIE) at Pallion Action Group to bring them the latest elements of the toolkit we’ve been co-designing with them. Since our last trip and series of workshops with them we’ve refined some of the thinking tools and adapted others to better suit the needs and capabilities of local people.
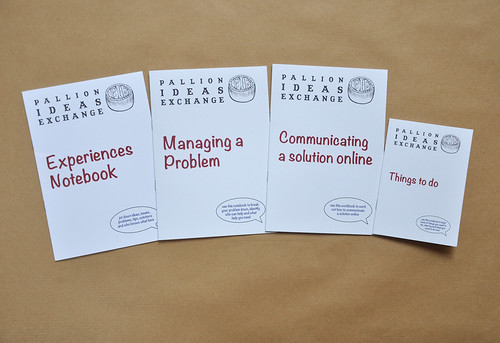
Pallion Ideas Exchange Notebooks & Workbooks by proboscis, on Flickr
Using bookleteer‘s Short Run printing service we printed up a batch of specially designed notebooks for people to use to help them collect notes in meetings and at events; manage their way through a problem with the help of other PAGPIE members; work out how to share ideas and solutions online in a safe and open way; and a simple notebook for keeping a list of important things to do, when they need done by, and what to do next once they’ve been completed.
We designed a series of large wall posters, or thinksheets, for the community to use in different ways : one as a simple and open way to collect notes and ideas during public meetings and events; another to enable people to anonymously post problems for others to suggests potential solutions and other comments; another for collaborative problem solving and one for flagging up opportunities, who they’re for, what they offer and how to publicise them.


These posters emerged from our last workshop – we had designed several others as part of process of engaging with the people who came along to the earlier meetings and workshops, and they liked the open and collaborative way that the poster format engaged people in working through issues. We all agreed that a special set for use by the members of PAGPIE would be a highly useful addition to their ways of capturing and sharing knowledge and ideas, as well as really simple to photograph and blog about or share online in different ways.
Last time I was up we had helped a couple of the members set up a group email address, a twitter account and a generic blog site – they’ve not yet been used as people have been away and the full core group haven’t quite got to grips with how they’ve going to use the online tools and spaces. My next trip up in a few weeks will be to help them map out who will take on what roles, what tools they’re actually going to start using and how. I’ll also be hoping I won’t get caught out by flash floods and storms again!
We are also finishing up the designs of the last few thinksheets – a beautiful visualisation of the journey from starting the PAGPIE network and how its various activities feed into the broader aspirations of the community (which Mandy will be blogging about soon); a visual matrix indicating where different online service lie on the read/write:public/private axes; as well as a couple of earlier posters designed to help people map out their home economies and budgets (income and expenditure).
Our next task will be to create a set of StoryCubes which can be used playfully to explore how a community or a neighbourhood group could set up their own Ideas Exchange. It’ll be a set of 27 StoryCubes, with three different sets of 9 cubes each – mirroring to some degree Mandy’s Outside the Box set for children. We’re planning to release a full Neighbourhood Ideas Exchange package later this summer/autumn which will contain generic versions of all the tools we’ve designed for PAGPIE as well as the complete set of StoryCubes.
Exlab; Art, Science and the Coast pre exhibition and talk
June 25, 2012 by aliceangus · 1 Comment

I have just packed Things I Have Found, Learned and Imagined on Burton Beach – the first set in a series of works on paper I am making to try and make sense of the the many narratives and local stories (of life, time, the sea, the land, folklore, history, industry, craft, science and geology) that have crossed our paths on Burton, Hive and Cogden Beaches for our Storyweir project. They are going to be part of an exhibition of work related to the Exlab commissions at the gallery in Arts University College at Bournemouth opening 9th July – 3rd August. There will be presentations by the 5 commissioned artists on the 12 July at 5pm.

ATLAS: Geography, Architecture and Change in an Interdependent World
June 20, 2012 by aliceangus · Comments Off on ATLAS: Geography, Architecture and Change in an Interdependent World

Earlier in the spring I received a copy of ATLAS: Geography Architecture and Change in an Interdependent World (edited by Renata Tyszczuk, Joe Smith, Nigel Clark and Melissa Butcher) a new book published by black dog publishing that brings together architects, artists and geographers to look at global and economic change. It is linked to and grew out of the web project ATLAS: making new maps for an island planet. Many of the contributors to these projects, like me, were part or participated in events or publications arising out of the Interdependence Day (ID) project back in 2006 and the organisers have gone to great lengths to keep those people and ideas together over the years through events, discussions and publications that keep progressing ideas and conversations.
For Atlas I revisited the project In Good Heart; What Is A Farm? (2009) which grew out of the partnership between Dodolab and Proboscis exploring communities, environment and resilience. I has been invited to visit the former Charlottetown Experimental Farm on Prince Edward Island, Canada, by arts organisation Dodolab. The visit, coupled with conversations with people and farmers, historical research into representations of farming, the lore of agriculture, weather, the seasons and the labours of the months, triggered many questions about land, farming and the factors that impact on this most ancient and technologically advanced of trades. The map created for ATLAS was inspired by these questions and the mediaeval illustrations of the Labours of the Months which were some of the first representations of farming and food production. It maps the interconnected stories people told me about what the word farm meant to them; their hopes and fears about food production and the harsh realities for farmers themselves. One of the things that struck me was how many people, who now live in urban places, recalled growing up on farms of visiting their grandparents farms. It impressed on me how swift the move from rural to urban has been for some people. Knowledge about environment has shifted with that move, some knowledge must have been lost and other knowledge is perhaps being created.
Shells for our Visualise commission
May 30, 2012 by stefankueppers · Comments Off on Shells for our Visualise commission

Some math of seashells
In one of our current (and I feel, pretty exciting) commissioned projects that is part of the Visualise Programme, we are looking at new ways of making accessible interpretations and translations of information in a physical series of objects instead of another classic information visualization.

Various Shell Shapes
Although there are many beautiful data visualisation examples out there, the big challenge they often face is that they are very frequently inaccessible to larger audiences. We are really interested in finding ways of creating something very emotive and tactile, giving a more intuitive insightful access to understanding content such as personal health information which really matters to people. We want to overcome it often being hard to decipher with current approaches and tools without being a health expert.

Gobos & Domes
Some interesting ideas are swirling around and en route I could reconnect with some ‘old friends’ that I got to know while still an architecture student many years ago: I have been revisiting D’Arcy Thompson‘s On Growth and Form and his in depth study of shell formation as an inspiration of how we might produce our own little evolving artefacts out of re-interpreted data spaces.
We have just been in the process of carrying out our own personal health data-capture with some off-the shelf kit (e.g. pedometer, blood-pressure, temperature) as well as environmental sensing via a couple of custom build Arduino data-loggers; the results of which we are now using for sketching out a variety of generative models for our new artefacts.
Watch this space for our first sketches of growing data!
‘We Are All Food Critics’
May 25, 2012 by mandytang · 1 Comment
The Soho Food Feast is just around the corner and I am so excited that the bookleteer notebook specially designed for this event will be used by the children of Soho Parish Primary School as they become food critics for the day.
I had a lot of fun illustrating the front cover for this notebook, though browsing through various mouth-watering photographs of dishes to illustrate before lunch wasn’t a good idea.


At first the initial sketch was rather unhealthy. It had more pastry, which seemed appealing to illustrate at the time because of its fancy presentation.But of course healthy eating is very important; especially for children, so the cover design was altered to a healthier version.


Inside the book in a very simple layout are spaces for children to scribble in and the blank pages at the back are for them to get creative and sketch their own feasts.
3 days in Pallion
May 19, 2012 by Giles Lane · Comments Off on 3 days in Pallion


This week just passed Alice, Haz and myself have been running some co-design workshops with local community members in Pallion, a neighbourhood in the city of Sunderland, and with Lizzie Coles-Kemp and Elahe Kani-Zabihi of Royal Holloway’s Information Security Group, hosted at Pallion Action Group. The workshops, our second round following some others in early April, were focused around visualising the shape, needs and resources available to local people in building their own sustainable knowledge and support network – the Pallion Ideas Exchange. We also worked on testing the various tools and aids which we’ve designed in response to what we’ve learned of the issues and concerns facing individuals and the community in general.
The first day was spent making a visualisation of the hopes and aspirations for what PIE could achieve, the various kinds of activities it would do, and all the things they would need to make this happen. Based on previous discussions and workshops we’d drawn up a list of the kinds of activities PIE might do and the kinds of things they’d need and Mandy had done a great job over the past couple of weeks creating lots of simple sketches to help build up the visual map, to which were added lots of other issues, activity ideas, resources and hoped for outcomes.


Visualising PIE this way allowed for wide-ranging discussions about what people want to achieve and what it would need to happen – from building confidence in young people and the community more generally, to being resilient in the face of intimidation by local neer-do-wells. Over the course of the first afternoon the shape changed dramatically as the relationships between outcomes, activities, needs, people and resources began to emerge and the discussion revealed different understandings and interpretations of what people wanted.
On the second day we focused on the tools and aids we’ve been designing – a series of flow diagrams breaking down into simple steps some methods for problem solving, recording and sharing solutions and tips online, how to promote and share opportunities to people they would benefit and things to consider about safety and privacy before posting information online. We’ve also designed some simple notebooks with prompts to help do things like take notes during meetings and at events, a notebook for breaking problems down into small chunks that can be addressed more easily alongside place to note what, who and where help from PIE is available, and a notebook for organising and managing information and experiences of PIE members about sharing solutions to common problems that can be safer shared online. As the props for a co-design workshop these were all up for re-design or being left to one side if not relevant or useful. An important factor that emerged during the discussion was that people might feel uncomfortable with notes being written in a notebook during a social event – the solution arrived at was to design a series of ‘worksheet posters’ which could be put up on the walls and which everyone could see and add notes, ideas or comments to. The issue of respecting anonymity about problems people have also led to the suggestion of a suggestions box where people could post problems anonymously, and an ‘Ideas Wall’ where the problems could be highlighted and possible solutions proposed. We came away with a list of new things to design and some small tweaks to the notebooks to make them more useful – it was also really helpful to see a few examples of how local people had started using the tools we’ve designed to get a feel for them:

On the afternoon of the second day we also spent a long time discussing the technologies for sharing the community’s knowledge and solutions that would be most appropriate and accessible. We looked at a whole range of possibilities, from the most obvious and generic social media platforms and publishing platforms to more targeted tools (such as SMS Gateways for broadcasting to mobiles). As we are working with a highly intergenerational group who are forming the core of PIE (ages range from 16 – 62) there were all kinds of fluencies with different technologies. This project is also part of the wider Vome project addressing issues of privacy awareness so we spent much of the time considering the specific issues of using social media to share knowledge and experiences in a local community where information leakage can have very serious consequences. Ultimately we are aiming towards developing an awareness for sharing that we are calling Informed Disclosure. Only a few days before I had heard about cases of loan sharks now mining Facebook information to identify potential vulnerable targets in local communities, and using the information they can glean from unwitting sharing of personal information to befriend and inveigle themselves into people’s trust. The recent grooming cases have also highlighted the issues for vulnerable teenagers in revealing personal information on public networks. Our workshop participants also shared some of their own experiences of private information being accidentally or unknowing leaked out into public networks. At the end of the day we had devised a basic outline for the tools and technologies that PIE could begin to use to get going.
Our final day at Pallion was spent helping the core PIE group set up various online tools : email, a website/blog, a web-based collaboration platform for the core group to organise and manage the network, and a twitter stream to make announcements about upcoming events. Over the summer, as more people in Pallion get involved we’re anticipating seeing other tools, such as video sharing, audio sharing and possibly SMS broadcast services being adopted and integrated into this suite of (mainly) free and open tools.
The workshops were great fun, hugely productive but also involved a steep learning curve for all of us. We’d like to thank Pat, Andrea, Ashleigh and Demi (who have taken on the roles of ‘community champions’ to get PIE up and running) for all their commitment and patience in working with us over the three days, as well as Karen & Doreen at PAG who have facilitated the process and made everything possible. And also to our partners, RHUL’s Lizzie and Elahe who have placed great faith and trust in our ability to devise and deliver a co-design process with the community that reflects on the issues at the heart of Vome.

View from our hotel in Roker
data logger for Visualise Lifestreams
May 18, 2012 by stefankueppers · 1 Comment
This week I have been putting together a little Arduino data logger for our current research collaboration with Philips in our Art & Tech commission project.

Arduino, openlog and TGS2620 gas sensor setup with GSR electrodes
We are exploring the translation of health and lifestyle data into new forms of tangible artefacts and for this we revisited mobile data-capture using Arduino boards to inform our early prototypes.
Alongside some Arduino boards we still had in the office I picked up a current crop of useful bits and pieces from Cool Components and RS (OpenLog SD logger + TGS2620 gas sensor) to make a quick, small and simple data-logger for simple capture of volatile gas proximity and basic galvanic skin response indicating anxiety levels.

TGS2620 gas sensor and openlog logger module
We need to capture long time periods of this sort of data on the move and thus were looking for a non-PC based data-logging set-up we could build ourselves. The Openlog board from Sparkfun is pretty convenient as it hooks up directly to the Arduino and can take micro-flash cards of large sizes so I got some 8GB cards for our logging exercises which will last for some good amount of data-capture time.
The Openlog board is tiny (literally a bit smaller than a 50 pence coin) and pretty straight forward to work with: It just hooks to the Arduino board in soft-serial mode. The galvanic skin response is better to be redone with an op-amp but a rudimentary approach will do for now for initial sketch-testing as we can always improve on the circuit later.
I will post some more feedback when I have played around with it some more.
Resources:
OpenLog github site documentation and code
Arduino Gas detection Fritzing sketch
Citizen Science in action: NASA Space Apps Challenge
May 14, 2012 by stefankueppers · Comments Off on Citizen Science in action: NASA Space Apps Challenge
Taking part in the 2012 NASA Space Apps Challenge

NASA SpaceApps Challenge 2012 Briefing
Within the Public Goods Lab here at Proboscis we have been exploring a number of themes we are tying together, one of which is a strong interest in the practice and production of ‘citizen science’. We like getting hands on and are always keen to learn from exitisting models and projects to understand the issues and possible modes and obstacles to production and delivery and so it makes a lot of sense for us to participate in projects that we can learn from.
To this end in late April I spent a fun weekend with my friend James from Imaginals and other space-fanatics at ISIC, the International Space Innovation Centre in Harwell, Oxford which played host to an extraordinary and fun challenge:
We joined the Oxford group of the NASA Space Apps Challenge; a brilliant event that was hosted in 25 cities around the globe (e.g. San Francisco, Tokyo, Melbourne, Canberra, Jakarta, Exeter; Nairobi, Sao Paulo, Santo Domingo and McMurdo Station, Antarctica….) drawing a crowd of 2000+ participants interested in creating ‘Apps’ relating to NASA space science under a number of possible themes; e.g. Software, Open Hardware, Citizen Science and Data Visualization.

Inspiring Space Science
The NASA Space Apps challenge was conceived as part of a much larger and very interesting ongoing US and global agenda in open government via the Open Government Partnership. The US Open Government Initiative is translating directly into Open Government activities at NASA; a programme to generate more interest in, access to and popularise ideas around NASA’s space science programme and enhance public visibility.

StrangeDesk Citizen Science Ideas
Our impromptu team (primarily assembled on the workshop weekend itself) consisted -Emal, Peter, James and myself – joined up because of our mutual interest in the theme of “Mobile Environment Capture”. We clubbed together with a hope of coming up with something that would relate it to citizen science and in particular exploring participatory models and ideas.
With lots of ideas being thrown around the table on the Saturday – for while we were joined by from ESA scientists who gave us some great insights – we decided to produce an idea that is looking to capture the excitement of engaging with space science from the ground by connecting citizen scientists through to the professional science community via our concept ‘StrangeDesk’. It’s our way to capture, share and aggregate odd, out of the ordinary and potentially important environmental events and connect them through the social web with the wider world including the professional science community to use and elaborate upon.

Strangedesk Start Page
Excitingly, in the weekend competition we must have hit some kind of nerve with the concept as we were lucky enough to win second prize in the local Oxford selections and are now moving into the second round with our idea.
Please check out our promo video we produced with the great help from Izzy Way at Imaginals for the second round of the competition on vimeo: StrangeDesk Promo
Support us by voting for it on the Talenthouse competion web site! and watch this space for any further news on this initiative!
You can also check out the twitter feed on the SpaceApps challlenge on twitter under #SpaceApps…
Visualising with Philips R&D
May 11, 2012 by Giles Lane · 1 Comment
Back in February Proboscis was commissioned by Andy Robinson of Futurecity, with the assistance of Dipak Mistry of Arts & Business Cambridge, to undertake an Art+Tech collaboration with a local industry partner in Cambridge as part of Anglia Ruskin University’s Visualise programme. This strand seeks to engage “leading Cambridge technology companies to collaborate with contemporary artists on the creative use of technology in public life.”
Over the past few months Stefan and I have been meeting with David Walker and Steffen Reymann of Philips R&D (based in the Cambridge Science Park) to establish a creative dialogue. The initial topics for our creative exploration were suggested by Philips based on research subjects being explored in their lab – Near Field Communications and health monitoring technologies. Our discussions quickly began to revolve around personal motivations for monitoring health and lifestyle –
- Why do people routinely lose abandon using health monitoring technologies?
- What might inspire new habits that actively involve monitoring?
- How could we create delightful ways for people to make connections between personal data and Quality of Life?
- How could we rethink the nature of data collection away from the purely rational towards the realm of the numinous and speculative?
Our initial thinking suggested that perhaps the problem with data collection is that it is often too crude and reductive – trying to make impossibly simple connections between phenomena in a complex system. Data visualisations are often barely more than pretty graphs – but our lives, our environments and the ways we live are so much more than that. How might we make tangible souvenirs from the data generated by our bodies and habits that could help us discern the longer term, harder to perceive patterns?
As our discussions have continued we have begun to explore how we might generate talismanic objects – lifecharms – from personal monitoring data using 3D fabbing. Things which could act as everyday reminders about patterns the data suggests, which are at once both formed of the data and yet do not offer literal readings of the data. Objects which are allusive, interpretative and perceptible, but still mysterious. What would it feel like to have an object in one’s pocket that was generated from data gleaned from one’s own body and behaviours? How might this help us maintain a peripheral awareness of the things we eat, how much we exercise, our general state of happiness and perceive the subtle changes and shifts over time?
Stefan is writing elsewhere how we have been inspired by shells – excretions produced by creatures that tell (in a non-literal way) the story of the creature’s life – what minerals it ingested, what environmental factors affected it. For the lifecharms we’re experimenting with using personal data to drive 3D morphogenetic algorithms that can generate unique shell-like forms which we’ll then render into tangible souvenirs.
As a more macro counterpoint to the micro of the personal lifecharms we have also been considering how local public health data could be translated into forms which could be experienced as a group in a public setting – we’re investigating making a ‘fly eye’ geodesic dome with a light source to throw light upon the patterns in the data.
We’ll be continuing our discussions with Philips for another 3 months or so, gathering some test data (from ourselves) then making some prototypes and maquettes of our ideas for an event in Cambridge in the Autumn where we’ll present our work.
Ideas exchange with Pallion
April 23, 2012 by aliceangus · Comments Off on Ideas exchange with Pallion
Just before Easter we were back in Sunderland working with Pallion Action Group and Royal Holloway, University of London’s Information Security Group on the project to help build a community network for people to share ideas about money, spend and budgets in ways that help them cope with the massive changes in the benefits system and reduction of the public sector’s contribution to the local economy.
I’m finding each time I visit PAG I’m more and more amazed at their ability to bring people together and invent solutions to tackle serious problems through creative thinking and activity. Their projects range from street dance, to pre-employment confidence building, mentoring of young people and projects to engage older people with technology. Although PAG are not an arts organisation their approach does remind me of two media arts orgs – Information and Cultural Exchange (ICE) in Western Sydney Australia and Knowle West Media Centre in Bristol. ICE open their doors to all sections of the diverse western Sydney community to join in a program of activities that enable communities and artists to tell the stories of this extraordinary place. Knowle West Media Centre is a media arts charity that aims to develop and support cultural, social and economic regeneration supporting communities to engage with, and benefit from, digital technologies and the arts.
These places have a commitment to valuing everyone’s voice in a democratic space. They’ve created environments that, because they are trusted and run by the community, encourage people to come to them they need an answer or a problem solved or just want to be involved. They all use creative processes, arts, music and film in their projects and through it are able to connect up people, ideas and communities to find solutions, support initiatives and ‘make things happen’ that are both practical and transformative.
PAG “was formed in 1993 by a small group of local residents who intended to take action relating to some of the problems that their community was facing.” Its mission is “To work to improve the living conditions, community facilities, social, educational and economic opportunities available to the residents of Pallion and surrounding areas of the City of Sunderland.”
Spending a few days in the building you get to see the way that PAG subtly makes opportunities for people to work together, to help each other as well as themselves. They are adept in seeing people’s passions, capabilities and capacities and supporting them. It doesn’t take long being there to be struck by the perceptive, resourceful and intelligent people who are involved in Pallion Action Group. People of all ages from many walks of life who have found themselves facing degrees of difficulty over lack of employment and a complex confusing benefits system.

On this last visit we were working with PAG on a shared design approach to mapping the broad themes, areas and issues and began to collect sample stories and experiences. We started with some basic explorations of resources in the home; what comes in and what goes out. It led onto more in-depth explorations of people’s perceptions : where did these things sit in relation to one another; what things people can rely on and what are unreliable; what is fixed, what changes? Finally we moved onto mapping what people’s aspirations are and the barriers that get in the way of achieving those. After these sessions we collaborated with members of PAG on scoping the next stages of the project and how it will intersect with current PAG activities and be supported by people involved in PAG. The discussion concluded that for this network to be of value it will have to enable people to improve their situation and not reinforce fears. Our focus for the project now rests on how what Proboscis does or brings to the process can connect with and supports PAG’s own work; how we can build on and exploit PAG’s skills and enhances (rather than adding more work) their efforts to build on their positive approach.
Bookleteer Animation Prep
April 6, 2012 by mandytang · Comments Off on Bookleteer Animation Prep

Props to be used for upcoming Bookleteer animation.
A snapshot of my cluttered desk, here’s a sneak peek of what I’ve been busying away with; these are props I am creating for an upcoming cut paper animation illustrating how to use Bookleteer.
Defining Public Goods: Folklore
April 6, 2012 by mandytang · Comments Off on Defining Public Goods: Folklore

Visual mind map about folklore.
Traditional beliefs, customs, stories passed down through generations, superstition; you’ve come across some of these at one point in your life or it may still be a part of you to this very day. My next mind map for the Compendium is about Folklore.
Here I explore the different methods to which groups maintain, share and pass on traditions. It also contains quotes from the New York Folklore Society website, where people expressed what folklore meant to them and how it affected their daily lifestyle.
The cultural aspect is a public good, the knowledge or reasoning of why something is the way it is. A method people use to teach others about experiences expressed as stories, songs, performance, legends, myths and rhymes.
It is something communities strive to maintain as folklore symbolise their identity to themselves and others.
Preparations for Pallion
April 4, 2012 by mandytang · Comments Off on Preparations for Pallion
As part of our work on the VOME project with researchers at Royal Holloway, University of London’s Information Security Group we are working with Pallion Action Group in Pallion in Sunderland on a community engagement project to co-design a process with the local community in Pallion, Sunderland to create a knowledge network around money, spend and budgets. We are collaborating with PAG to identify the areas and issues challenging people around household economies. The project feeds into VOME’s aim of “exploring how people engage with concepts of information privacy and consent in online interactions”.
We’ve have been co-designing designing a set of huge posters with people at PAG to help gather knowledge and find the right language to use. We took a first set up recently for the first exploration session, and based on peoples’ comments revised and changed them and will be heading off to do a two day series of activities with local people to dig deeper into peoples concerns about costs, spend, what we can rely on and what is unreliable. I think the project is going to involve some very interesting cycles of creating, discussing, revising, changing and re-producing materials until we can collaboratively come up with the right materials.


Defining Public Goods: Places to Meet and Hang Out
March 29, 2012 by mandytang · Comments Off on Defining Public Goods: Places to Meet and Hang Out
Continuing my exploration into public goods for the Compendium I thought about public spaces; parks, the town square, spaces that doesn’t require a fee to access. In these spaces, we often see people walking around, hanging about, waiting for someone, conversing with each other, and so on; and then it hit me – places to meet and hang out can be considered as a public good. These could be conventional spaces such as the park or places that encourage socialising like a cafe, but there are also informal spaces; ones that are not dictated.
An example of an informal space brings me back to my university days; every weekend when I had to go to the main high street to buy food for my deprived fridge, I would have to walk through the town square where flocks of teenagers would hang out, spreading across the flights of stairs and having to dodge the dangerous skater boys practicing stunts from one side to the other. It was the same every weekend without fail.

Visual mind map about places to meet up and hang out.
Programmable Matter By Folding
March 26, 2012 by mandytang · Comments Off on Programmable Matter By Folding
Not quite the paper theme but still folding! This was a video clip I had seen a few years back, and it was my current research for the Compendium that reminded me of the video.
A demonstration created by the Pentagon research scientists; of a tiny robot as thin as a piece of paper covered with predefined folds. It wasn’t quite origami but using algorithms the tiny robot folds itself into the shape of a boat and then a paper plane. Quite amazing huh? I am not confident enough to go into robotics just yet, but for now I think I’ll stick to paper craft.
Animation Experiment #3 – The Tortoise and the Cube
March 23, 2012 by mandytang · Comments Off on Animation Experiment #3 – The Tortoise and the Cube
Continuing with my experiments for the Compendium using paper crafts, I wanted to try animating with 3D models. To animate something that was flat pack and have it lifting up as if inflating and popping up into shape from the ground. So I went on a hunt for a 3D paper model – thus coming across the tortoise designed by Konica Minolta. It took some time to assemble but the finished tortoise looked great.

I named the studio's new pet, Yumi.
But Yumi was not a flat pack, she was made up of separate pieces, so the aim of the experiment changed slightly to experimenting puppetry with Yumi a 3D model and have a story cube inflate into shape instead. This time round the experiment had two subjects or actors if you will, in the scene. So the difficulty here was getting the timing right between the two.

Screen captures of Yumi walking around the cube as it folds itself.
Turntable Hack
March 19, 2012 by stefankueppers · Comments Off on Turntable Hack
The other week Alice and Mandy started evolving ideas around the use of Zoetropes. Mandy produced some wonderful origami birds and Alice sketched out a series of cardboard mock-ups on a wooden ‘cheese board’ turning platter. These worked nicely for some very initial sketches but would not allow filming well and the rotation speed would vary.
Alice found some great turntable hacks for Zoetrope out on the web that got us thinking: Our Zoetrope experiments needed more control and flexibility in the electronic and mechanical design aspects so rotation speed could be controlled more precisely in future design iterations.

The hacked turntable ensemble
Ok: The Public Goods Lab (i.e. myself and the kit…) got involved in its technical capacity to support this. Alice brought in her old Technics turntable and I had a go at making our own motor driven Zoetrope as a hack from it: As it turned out with her turntable the real issue was that it it did not allow placing arbitrary size objects on the platter as the Technics model was designed as a slide-out chassis so we needed to do something with it before we could use it for Zoetrope testing.
I got onto disassembling the chassis getting the rotating platter out of it with its motor. The electronics were so tied to the chassis that I decided to just fix a stepper motor on the side of the platter base and made a little Arduino controller and breadboard motor driver circuit to go with it. The driver circuit is just suing a ULN2003A chip for a quick and simple test ( That chip is a multi-transistor package so I did not have to roll my own H-bridge).
I first used a unipolar stepper [4 connections] but the circuit [I used this post from eLABZ blog ] was getting a bit hot with a floating voltage across the driver chip so I ended up reverting to a bi-polar stepper motor (still using the same circuit as above but dropping the floating voltage and this works just fine without the driver chip overheating. There are two poer supplies, one driving 5V for the Arduino board and another 12V supply for the stepper motor driver. Both were taken from an old hard disk power supply and wired into a breadboard. The circuit used has a tow small switches that let you change the stepper direction which is a nice convenience.

Arduino + Stepper driver electronics
More code hints for Arduino stepper control see the
introductory Arduino stepper control tutorials
The code can be tuned to change the speed of the stepper a little bit but this could alaso be extended with more control buttons in the circuit which we may do if we really need it.
Defining Public Goods: Craftsmanship
March 16, 2012 by mandytang · Comments Off on Defining Public Goods: Craftsmanship
I’ve always admired the works of a craftsman, and I definitely feel that their skill as an artisan can somehow be reflected in the Compendium. But can craftsmanship really be considered as a public good? I turn to the Heritage Crafts Association, advocacy body for traditional heritage crafts for some answers. There I find an article by Professor Ewan Clayton, who explains all that I am unable to convey in words.
He talks about the importance of heritage crafts and that “craftsmanship have an interesting relationship to time” the embodied wisdom from the craftsman of a time is reflected in the artefact created, the interaction or activity that may involve the artefact, becomes a cultural resource.
He also mentions the focus in safeguarding traditional craftsmanship should not be made to preserve craft objects but to create conditions to encourage artisans to continue their practice and to transmit their skills and knowledge to others.
I also stumbled upon Richard Sennett’s book titled Craftsman, which mentions how medieval workshops provided a communal atmosphere and a social space, that bound people together forming a community of masters and apprentices.
Both Professor Ewan Clayton and Richard Sennett made insightful points about craftsmanship in the past and in our current lifestyles, it was also a sad reminder of craftsmanship that have become so rare and at risk of being lost forever that it made me want to learn more about them.
I wrap up this post with a quote from Professor Ewan Clayton’s article “So this intangible cultural inheritance that crafts carry is not only about our past – it’s about the vision of what it means to be human. It’s about now, and its about our future as well.”

Visual mind map about craftsmanship.
Animation Experiment #2 – Origami Crane
March 14, 2012 by mandytang · Comments Off on Animation Experiment #2 – Origami Crane
The folding paper piece was quite quick and simple to animate, so the next one to experiment with for the Compendium needed to be a bit more challenging. A self folding origami crane. For those who are familiar with folding the crane, you’ll know that the crane have symmetrical folds ; so the real challenge here was working out how to make the paper flip over to carry out the repeated folds once one side completed the necessary step. My first attempt in solving this issue became too complicated and confusing, that I had to stop animating and go back to the drawing board to revise the storyboard.

Storyboard for self folding origami crane.
Following the new storyboard the animation progressed at a good pace at the start but towards the end I wasn’t consistent with the number of key frames so it may look like the crane got impatient and hastily folded itself during the last few seconds. Despite the frames per second, I achieved the main goal of animating a self folding origami crane! But to maintain the consistency of frames, I am going to need to devise a time sheet to go along with the storyboard.

Animating in progress.

Screen captures of the self folding origami crane animation experiment.