
Special Offer #2 : Fridge Magnets & Pack of Cards
December 1, 2012 by Giles Lane
Our second special offer (to raise funds for new projects and initiatives) is a great deal on two of our most popular items – Alice’s Endless Landscape Magnet set and our (somewhat eccentric) pack of cards, Being in Common : Catalogue of Ideas.
We’re offering them together at 50% off their usual price – perfect as gifts for people who like to make up thwir own games and stories! Get them for just £12.50 plus post and packing.

|
2012 Special Offer 2
Endless Landscape Magnets + Catalogue of Ideas cards |
|||
|
United Kingdom
|
European Union
|
USA & Canada
|
Rest of the World
|
|
£15
(inc p+p) |
£16
(inc p+p) |
£17
(inc p+p) |
£18
(inc p+p) |
 |
|||
|
Pay with Paypal
|
|||
Special Offer #1 : COIL sets, Case of Perspectives, Magnets & Cards
December 1, 2012 by Giles Lane
This year we’re offering some special offers to help raise funds for new projects and initiatives. The first offer is a limited number of packages (15 sets only) of some of our loveliest publications – including :
- Complete set of COIL journal of the moving image (1995-2000)
- Social Tapestries : A Case of Perspectives (2007)
- Alice Angus’ Endless Landscape Magnet Set (2006)
- Being in Common – A Catalogue of Ideas (2009)
We’re offering all this for £35 plus post & packing – a third of their combined original prices!
*** Hurry – we have only 9 of these available ***

|
2012 Special Offer 1
COIL journal set + Social Tapestries: Case of Perspectives + Endless Landscape Magnets + Catalogue of Ideas cards |
|||
|
United Kingdom
|
European Union
|
USA & Canada
|
Rest of the World
|
|
£40
(inc p+p) |
£43
(inc p+p) |
£45
(inc p+p) |
£47
(inc p+p) |
|
|
|||
|
Pay with Paypal
|
|||
To Papua New Guinea
October 23, 2012 by Giles Lane

Tomorrow I start my journey to Papua New Guinea where I’m taking part in the Saem Majnep Memorial Symposium on Traditional Environmental Knowledge (TEK), hosted by the University of Goroka (Eastern Highlands Province) and supported by the Christensen Fund. The title and abstract of my talk at the symposium is:
Digital and Physical : simple solutions for documenting and sharing community knowledge
My work is about engaging with people to identify things which they value – for instance knowledge, experiences, skills – and how they can share them with others in ways that are safe, appropriate and inspiring. As an artist and designer I have helped devise simple tools and techniques that can be adopted and adapted by people on their own terms – such as uses of everyday paper, cameras and printers alongside digital technologies such as the internet, archives and databases. I will demonstrate some examples of how these simple physical and digital tools can be used to share community knowledge in freely and easily accessible ways, so that they can also be re-worked and circulated in both paper and digital formats. I hope to offer some examples of how TEK in PNG might be widely documented and circulated as part of commonly available resources.
I wrote a piece about my initial thoughts on what I’ll be presenting and doing whilst I’m there on the bookleteer blog last month. My invitation to this event has been through James Leach, Professor of Anthropology at the University of Aberdeen who will be there presenting his collaborative publication, Reite Plants, with Porer Nombo in whose village James has been doing fieldwork for 20 years. I first met Porer three years ago when he visited the UK to assist the British Museum’s Melanesia Project in identifying artefacts from the region where he lives in the Ethnographic Collection. At the time James had asked me to help him devise some new ways to document this kind of Traditional Knowledge Exchange that would capture something of the experience of all sharing knowledge that more institutional methods might miss. Consequently we used some Diffusion eNotebooks to capture and record our interactions as much as the stories and information that Porer and Pinbin shared about the artefacts. Alice and I also had the privilege of spending time with Porer and his fellow villager, Pinbin Sisau, inviting them to our home for an evening with James and his family and sharing with them some of the simple delights of central London life that people who don’t live here wouldn’t experience.
After the symposium James, Porer and myself will travel back to Porer’s village of Reite on the Rai Coast in Madang Province where we’ll stay for a week or so. There we’ll attempt to put some of our ideas into practice – I’ve designed some simple notebooks for us to use out in the bush, some printed on waterproof paper, others printed on standard papers. I’m very excited to have this unique opportunity to test out ideas I’ve had for using the Diffusion eBook format and bookleteer in the field for over 10 years now – harking back to conversations I had with anthropologist Genevieve Bell of Intel in 2003. I’m also very excited to have the privilege of visiting Porer and Pinbin in their home and meeting their families and community – joining the loop of one smaller circle of friendship and exchange and hopefully spiralling out into some larger ones that will continue into the future.
Ending an era, beginning a new chapter
October 20, 2012 by Giles Lane


Its been 12 years since we published Performance Notations, the first series of Diffusion eBooks, and launched our unique publishing format on an unsuspecting world. In that time, we have commissioned and facilitated hundreds of original eBooks and StoryCubes by an incredibly diverse range of people from all kinds of disciplines and backgrounds. In that time we also began to evolve our own free and online software platform for people without professional design skills to be able to create their own eBooks and StoryCubes. Our first proof of concept prototype was made in the summer of 2003. We then spent a few years building a fully working version – the Diffusion Generator – which was online between 2006 and 2009. In September 2009 we launched bookleteer, a whole new set of ways for making and sharing eBooks and StoryCubes.

A New Place for Future eBooks & StoryCubes
This summer we made a series of technical changes to bookleteer that allow users to share their own publications directly with others via a Public Library. Each user has their own personal profile page listing all their shared publications (for instance, here’s mine) and each publication has its page listing both the downloadable PDFs and the bookreader online version (for example, see Material Conditions: Epilogue). We have further exciting developments in the pipeline too.
To continue our long tradition of commissioning and publishing new work, we have created a new Curated by Proboscis library which will, from now on, be where all new commissions and featured eBooks and StoryCubes will be listed. Our long-serving Diffusion Library website will remain online indefinitely as an archive of more than 12 years of pushing the boundaries of what we think of as publishing and creative practice.

![]()
As part of these changes we are also launching a new monthly publication – the Periodical – which will select, print and send out to subscribers some of the most exciting, experimental, imaginative and insipring eBooks created and shared on bookleteer. Anyone can take part – just sign up, make and share something on bookleteer. Each month we’ll pick one eBook to print and send out. We are also devising special projects, like Field Work, that will enable people to participate in other ways. And we are developing partnerships and collaborations to commission new series that will also be distributed as part of the Periodical’s monthly issues.
Subscribe to the Periodical and get bookleteering!

Installation at Bridport Arts Centre
October 17, 2012 by aliceangus

Some images of the last of the various Storyweir installations from this summer and autumn made with Gary Stewart and Stefan Kueppers, these works are at Arts Centre 13 October till 23 November 2012.
We are showing a new 2 screen audio and video work and a series of 22 works on paper tracing the research ideas. Inspired by the notion that history looks different depending on your perspective, the video clips are randomly selected from a bank of video shot at Hive Beach along with maps, scans of the seabed, drawings and old films. It features footage of several people whose activities bring them into contact with different cycles of life of the area including a fossil hunter, an archaeologist, a kayaker, a member of Coastwatch and Bridport Wild Swimmers. Data about Wave height, wave period and wave direction data gathered over the summer at West Bay is being used to control and modulate an ambient soundtrack that accompanies the voices of many people who live, work and play on the coast.


Sea Shell Maths
October 16, 2012 by stefankueppers
This post is one of several exploring the research and creative processes Giles and I have undertaken for our project Lifestreams, an Art+Tech collaboration with industry partner, Philips R&D in Cambridge as part of Anglia Ruskin University’s Visualise programme.
Our interest in using sea shells as the basis for making tangible lifecharms meant that I had to dive deeper into the maths, biology and development of shells to get a handle on how they grow and also to understand a bit more about what actually goes on at a physiological level. Fortunately there is a long history of the study of shell shapes and morphologies by different disciplines, biologists, mathematicians, artists et al to draw upon.
In my research I have come across many descriptions and models of shells, ranging from mathematical descriptions to those exploring the more complex biological processes involved in their genesis: these for example incorporate the growth of so called cellular templates which then undergo bio-mineralisation solidifying a soft scaffold of tissue into a rigid structural extension of the shell.
Essentially shells represent a geometric pattern that nature embraces and uses repeatedly in many biological structural systems such as the cochlea in our ears. sunflower blossoms and pine tree kernels. It is the the logarithmic helico-spiral. Imagine a flat logarithmic spiral that is then dropped from its centre on to the top of a cone and the spiral path then successively drops and drapes itself onto the surface of the cone.
This results in the 3-dimensional spiral that provides the growth direction for a generating curve which deposits different types of cellular tissue in sequence. The generating curve moves in three dimensions twisting, turning and changing dimension and rotation, at times even (depending on the shell species) changing its edge shape along the route. This then creates the intermittent bulges and outgrowths and sometimes sinusoidal waves along the shell edge.
Different types of shells come to being from a variety of generating curves and shapes that expand along the length of this spiral path as the shell grows. The height or flatness of the cone determines the compression of the helico-spiral on its central axis. As the shell grows the leading edge can vary in shape following rhythmic patterns or sporadic outgrowths. This has equivalents in natural growth phenomena in plants and becomes visible for example as growth rings in trees.
As a shell grows in volume it simultaneously adds variable patterning on the exterior surface of the shell affecting growth based both on environmental and health factors. The surface colouring of the shell is patterned through a diffusion reaction process taking place just at the outward facing shell edge. The mollusc itself is never in direct control of this external pattern as it grows and even within the same species these patterns can vary dramatically.
What has been interesting in taking the formulas as a departure point into a series of parametric and other model variants is that the math evidently only is an approximation of the sea shell form. Some nuances are missed in the pure formula generated shell approach and this became evident when I changed the way I was modelling my shells in different systems and moved away from using straight functional geometric models to more iterative and generative types.
D’Arcy Thompson: On Growth and Form @ InternetArchive
Seashells: the plainness and beauty of their mathematical description
D. Fowler, H. Meinhardt, and P. Prusinkiew, Modeling Seashells
Storyweir at Bridport Arts Centre
October 10, 2012 by aliceangus

Yesterday we delivered a series of research drawings and video work made in collaboration with Gary Stewart and Stefan Keuppers to Bridport Arts Centre for their exhibition of a selection of work from ExLab2012. Gary and I have been working on a new two screen audio & video work inspired by conversations about the experience of time and memory we had with the Cultural Geographers from Exeter University we’ve been collaborating with this summer for our Storyweir commission at Hive Beach. Hive Beach is a continually shifting strip of shingle between the land and sea where the endless cycles of sun, tide and waves cause changes larger than we can imagine, but which are also felt by humans on a daily basis.
The new video at BAC is a new piece combining video shot at Hive Beach with maps, scans of the seabed and archival material. It features footage of several people whose activities bring them into contact with different cycles of life and histories of the area including a fossil hunter, an archaeologist, a member of Coastwatch and Bridport Wild Swimmers. Data on wave height, wave period and wave direction data gathered from the Channel Coastal Observatory beuy at West Bay is being used to control and modulate the ambient soundtrack that accompanies the voices of people who live, work and play on the coast.
You can see it at BAC from 13 October to 23 November.

Designing for the Pallion Ideas Exchange
October 2, 2012 by mandytang
To support the Pallion Ideas Exchange, we have created numerous printed materials including posters, worksheets, postcards, work flow diagrams and eBooks. These have been designed to help record concerns, hopes and aspirations, which could then lead to further discussions and point to the right person who may have had the same experience.
The design ideas behind these printed materials relied on the feedback and conversations the team had gathered with the members of the community in Pallion. It became a highly iterative process of adapting earlier work though co-design and initiating and making new pieces such as the workflow sheets as a response to ideas and suggestions that had been gathered in our workshops.
The main consideration when designing, was the importance to keeping it visually simple and informal. One example being in the eBooks, we didn’t want to create pages that may put people off by making it look too similar to application forms, but we wanted the eBooks to have a familiar structure for people to fill in with ease. To overcome this, I simply drew the boxes by hand; adding a folded corner and colour coded the outline to indicate the page sets. We agreed that the hand drawn method seemed more approachable and was implemented on all the other printed materials.
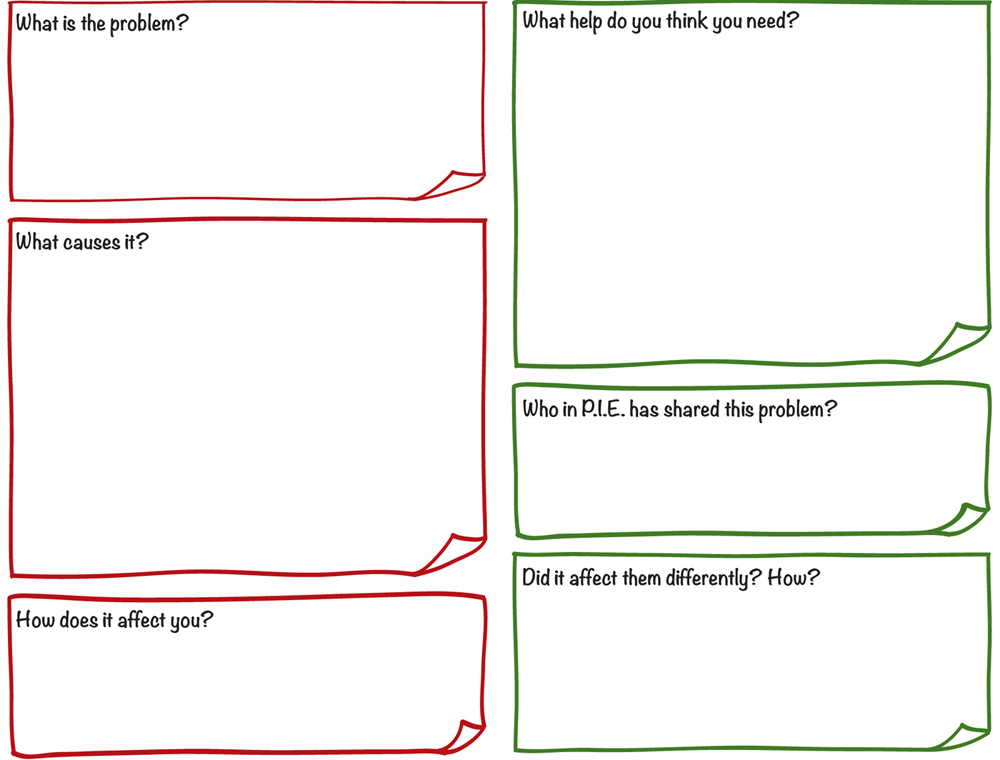
From the “Managing a problem” eBook
The illustrated scenarios had to be within an informal environment and drawn simply, but most importantly; approachable. So instead of my usual mannequins which you may have seen in previous projects, these illustrations of people had a very simple outline. The props and environment were kept minimal, with only flat colours highlighting the activity. With this a library of illustrations were created for the team to use.

Examples of some of the illustrations; the one of the left is someone giving advice to another, and on the right is of an activity.
The most challenging part of the project when illustrating was creating the three “Aspirations” images that are used in the “Visualising the network” map to reflect what the community hope to achieve in terms of “social cohesion”, “a better local environment” and “better life opportunities”. Each had to reflect various aspects in a single image, most of which were easy to explain in words but to frame it in one image required a lot of conversations amongst the team and just thinking about situations which we ourselves may have experienced or seen. The process for this particular part of the project was to think of how each aspect would be illustrated individually and gradually piece them together and tweaking it to make it work as one whole image.

Visualising the network map
Although at first we weren’t sure how the “Visualising the network” map should look like we used these three aspiration images as a starting point and the rest was straightforward. Having created a library of illustrations for activities and resources for PIE that we’ve used across the project, I re-used many of the images so that they will become easily recognisable.
These image files will become part of Proboscis’ forthcoming Neighbourhood Ideas Exchange Toolkit along with generic versions of the posters, worksheets, work flow diagrams, eBooks and postcards we have developed for the Pallion Ideas Exchange project. With this toolkit we hope to inspire others to adopt and adapt the parts for their own local social innovations.
Field Work and the Periodical
September 26, 2012 by Giles Lane
Publishing remains at the heart of Proboscis. We began 18 years ago with COIL journal of the moving image and followed this with many series of Diffusion eBooks. Since 1994, we have commissioned and published works by hundreds of different people in many formats.
Our latest publishing venture, the Periodical, aims to re-imagine publishing as public authoring – a phrase we’ve been using for over 10 years to describe the process by which people actively make and share what they value – knowledge, skills, experiences, observations – those things we characterise as Public Goods. Based on bookleteer, the Periodical is a way for people to participate in publishing as well as reading – in addition to receiving a printed eBook (sometimes more than just one) by post each month subscribers are encouraged to use bookleteer to make and share their own publications, which may then be chosen to be printed and posted out for a future issue.
Our first project being developed as part of this venture is Field Work : subscribers will be sent a custom eNotebook to use as a sketch and note book for a project of their own. Once they’ve filled it in they can return it to us to be digitised and shared on bookleteer. Several times a year we will select and print someone’s Field Work eNotebook to be sent out as part of a monthly issue of the Periodical.
Why are we doing this? We’ve long used the Diffusion eBook format to make custom notebooks for our projects and digitised them as part of our shareables concept. We think that such new possibilities of sharing our creative and research processes with others is a key strength of what these hybrid digital/physical technologies offer. Creating a vehicle, via the Periodical, for others to take part in an emergent and evolving conversation about how and why we do what we do seems like a natural step forward. If you’d like to take part, subscribe here.
Shell drawings
September 25, 2012 by stefankueppers
This post is one of several exploring the research and creative processes Giles and I have undertaken for our project Lifestreams, an Art+Tech collaboration with industry partner, Philips R&D in Cambridge as part of Anglia Ruskin University’s Visualise programme.
I have talked in a previous post on lifecharms to shells about talismanic, engaging and tangible transfigurations of lifestyle and health data in the form of sea shells. I now needed to explore the real thing. Off I went on another little spree of discovery both on-line and the real world, picking up a variety of ‘snails’ trails if you will.

I had been making some initial sketches of shells whilst looking at some of the mathematical models that have been around for shells (more of this in a later post) and got deeper into the strange and wonderful world of shell forms to pick p ideas for forms and processes that I could draw on in the making of our own shells.
Aside from producing a large haul of images from various on-line searches I wanted to make sure I would see a broad variety of the ‘real thing’. So being in London I went on to do take some pictures of ancient and contemporary shells in the wonderful and inspiring Natural History Museum within its fossil and invertebrate collections.

From these I made a lot of sketches for our life-streams shells so that I could get a deeper taste and sense of the kind of shell shape variations that exist. To me these sketches helped me to gain a clearer more visual understanding of some of the various archetypes and key differences in different shell structures that I came across. It got me to think about routes for the shell modelling process I have been evolving alongside on the computer and the 3d printers.

I had looked at both ancient fossils which had lost any of their external pigmentation as well as contemporary shells that still retained all their wonderful colour and detail. I am continuously amazed at the range and expressiveness of shapes and colours pigmentation of shells that are out there.
From lifecharm to shell
September 19, 2012 by stefankueppers
This post is one of several exploring the research and creative processes Giles and I have undertaken for our project Lifestreams, an Art+Tech collaboration with industry partner, Philips R&D in Cambridge as part of Anglia Ruskin University’s Visualise programme.
From its beginning our collaboration with Philips R&D had a focus on lifestyle and health as the two key subject areas so they have formed an integral part of our dialogue and explorations. We’ve spent time in our discussions making and reflecting on the cross-connections between the two; how they intersect and influence each other. As our discussions evolved, we became more interested in some of the challenges for expressing and documenting personal and collective lifestyle choices visibly or invisibly affecting personal health and quality of life.
Stimulating personal motivation for change or reinforcement of positive activities through new means of reflection emerged as goal worth exploring further. Our primary purpose has been driven by thinking of ways and means to make lifestyle choices visible as a means for reflection and possible behaviour change.

We debated what the possible scale and scope of factors affecting our lifestyles were that could be points of reflection; what the nature is of the need for both individuals and groups to see and reflect on the impact of their own and collective choices on health, well-being and quality of life. Our enquiry ranged from evolving ways to make visible and re-enforce positive patterns to ways of making bigger changes to negative patterns. Our aim is to be able to engage people both through individual and collective reflection and debate.
For instance, what could be vehicles for change that have broad reach spanning young and old without requiring great depth of knowledge to ‘read’ complex information? What could be more emotive, accessible, tangible and shareable? That could indeed inspire a visceral and instinctual form of personal and public reflection? What would form could this take?

Our response to these questions was to take totemic objects as emotive points of reference – iconic and tactile tools for ongoing reflection. We began planning to evolve talismans of self-health, personal pieces that could be carried around on a keyring or as jewelery to remind ourselves of what matters to us. The might be like the charms of old, bracelets embellished with objects, tracing key events and people in our lives but extended to become markers for health and quality of life.

From these ideas of the charm we searched for physical forms that could act as personal objects attached to life, as symbols that are already in the public mind. We arrived at the seashell.

Lifecharm Shells Redux
September 18, 2012 by Giles Lane
Our collaborator at Philips R&D in Cambridge, David Walker, was generous enough to have some of the Lifecharm shells fabbed in a range of more exotic materials than our initial prototypes using Shapeways (a 3D printing firm spun-out of Royal Philips Electronics). The materials used range from metal/silver, ceramic and frosted and transparent glass.


Many thanks also to Dipak Mistry, our collaborator on Visualise Lifestreams at Arts & Business Cambridge who dropped them by the studio this morning.
Storyweir at Hive Beach video
September 8, 2012 by Giles Lane
Saturday 8th and Sunday 9th are the final two days of Storyweir on Hive Beach. This video documents the two evenings of projections and live cello performances, by Matthew Benjamin, on August 3rd & 4th.
Proboscis at Burton v3 from David Rogers on Vimeo.
Storyweir – last few days to see
September 5, 2012 by Giles Lane
Our installation on Hive Beach in Dorset, Storyweir, finishes on Sunday 9th September. Here are some photos taken by photographer Pete Millson. From October 13th we will also be participating in an exhibition about the ExLab commissions in Bridport Arts Centre’s Allsop Gallery.


bookleteer – a fresh look and new features
August 27, 2012 by Giles Lane
Last week we quietly updated bookleteer to give it a fresh look and to introduce the sharing features we announced previously. We’ve been tweaking and bug-fixing over the last week or so and are now very excited to let everyone know about it.
New Look Home & About Pages
We’ve refreshed both home and about pages to make it clearer what bookleteer is and what it can do.


Public Library Page
The new Library Page allows anyone browsing bookleteer to see what eBooks and StoryCubes have been created and shared by members.

Individual Publication Pages
Each publication that is shared publicly has a unique page created for it which can be linked to and shared via popular social media services (Twitter, Facebook etc). eBooks have an embedded version of the bookreader in the page for previewing as well as download links for the PDFs. StoryCubes also have preview images and download link.


Member Public Profile Page
A new public profile page has been created to list all the shared publications by each member, also displaying a short bio and links to personal blog, website, twitter and facebook pages. These can be added in the member’s account page.


These are just the first in a series of updates and improvements to bookleteer that we’re adding over the next few months – stay tuned for further announcements!
Presenting the Lifecharm shells
August 9, 2012 by stefankueppers
This morning we are off to Cambridge for our final meeting with our collaboration partners at Philips R&D, where we will be presenting the lifecharm shells we have generated from our health data and talking about where we will be taking the project next.

Of fly-eye domes and public health data sets
August 8, 2012 by stefankueppers
This post is one of several exploring the research and creative processes Giles and I have undertaken for our project Lifestreams, an Art+Tech collaboration with industry partner, Philips R&D in Cambridge as part of Anglia Ruskin University’s Visualise programme.
As part of our quest to explore making health data tangible we began to research means of experiencing larger volumes of collective health data as a complementary experience to the ‘lifecharms‘ illustrating individual data streams. We imagined these different strands operating in tandem to provide micro and macro perspectives on how we can forge new relationships to health and wellbeing.
The question immediately arose of how we could achieve meaningful translations of complex health data. Our initial solution was to turn public health data (derived from Network of Public Health Observatories) into varied surface expressions on a larger installation work, allowing a degree of participation from direct public interaction to inform manipulations of the public data sets. To achieve this we thought about the production of manipulated stacking surfaces that would aggregate into a communal structure.
Our idea for manifesting this health data was to take each data set, determine its dimensions (i.e. which and how many data ranges does it have, what do they represent? e.g. mortality rates, obesity, etc.) and take each of these to be the driving parameters of a set number of ways to cut, punch, emboss or bend thin sheets of material, either paper, card or metal. We would then create one layer of material for each data dimension, apply the parameter controlled action for it (ie, print, cut, punch, bend; where and by how much) and do this for each of the data dimensions.

For each dataset (by ward or time span) we would end up with a stack of screens which together would define a unique surface or mask that would be specific in both tactile and visual effect. These stacked screens would make up the facets to be collated into a larger physical structure that would evolve out of the geometry of the base shape and be assembled by members of the audience to ‘collectively grow’ the public health data installation piece.

We proposed to use Buckminster Fuller‘s fly-eye dome as the base for a slightly larger than human size dome structure which would rest on a tripod-like support structure under which visitors could move to look up and in. The fly-eye dome is a design variation on Bucky’s earlier geodesic dome structures lending itself well as a projection structure. We planned to use it to present transformed public health datasets which become layered and patterned masks to produce alternating light and shadows from within the dome surface. Each facet, or mask, would be representative of a specific grouping of public health data, either by time interval or by geographic proximity.

In thinking about how this would work as an installation, we came up with two different projection approaches creating two types of experiences:
- Outward facing masks with switch-able internal illumination creating projections that are cast on the gallery wall interiors and,
- Inward facing masks with with external illumination where the audience steps inside the dome structure manipulating an exterior light source (or ‘sun’) around the dome structure by hand.

A very attractive benefit of collaborating with Philips is their expertise and product range in professional lighting. In particular, Philips has developed a product series and related technologies called LivingColours which we considered to be a good option for the illumination in our fly-eye domes.
Despite developing this concept quite far, we eventually moved away from it as we felt it didn’t encompass enough of a sense of the living and organic processes which we want to engage people in. In many ways we felt it was moving back towards static data visualisations that are too readily ‘readable’ and which soon cease to have the power to engage people in an ongoing and reflective relationship with how public data can be seen as part of the environment in which we exist.
Video clip of Storyweir Performance at Hive Beach
August 8, 2012 by Giles Lane
A short video clip from the Storyweir performance at Hive Beach, Dorset on Friday 3rd August 2012. Video projections by Proboscis (Gary Stewart & Alice Angus) with live cello by Matthew Benjamin.
3rd generation of 3D printed Shells for Visualise
August 2, 2012 by stefankueppers
Our third round of shells fresh out of fabrication is here!

I am excited that we now have shells that are more organic and life-like coming through. To drive this additional complexity I’ve been experimenting with mixing the combinations of data and exploring how these generate more ‘organic’ forms as they are fed into different parameters of the growth grammar.
In my last post I described how I’ve developed a bespoke shell model by programming in JAVA with growth grammars which start out with mathematical principles. These project a spiral onto the surface of a cone in 3D for the primary growth curve. Then I begin to tweak and subvert the surface shape as it grows, adjusting the rhythms and patterning of the data to add a degree of interpretation.
This is very interpretive and not hard science; it is not classic data-visualisation or information graphics. I take sets of health and lifestyle data and make deliberate decisions in how I interpret what kind of ‘expression’ they generate. It is highly designed and crafted process which I am evolving to achieve both an aesthetic outcome, but also one where the data plays a key role that may not be transparent or simply ‘readable’ like a graph, but rather becomes emotive.
This is important and different in that we are trying to produce a sense of meaning that is not read through classic symbols but rather through a tactile and visual experience. The tangible form of the shells embodies rhythm, resonance or dissonance; attraction or repulsion.

What we are attempting is not just a ‘transduction’ of health data into physical form, but a transformation of how we develop relationships with that data and what it means for us. The data is captured and transfigured into the physical form of the shells – producing something which is magical, transformative and which cannot be easily read but is heavy with the potential for meaning. The shells become more like talismans than just static instantiations of data.
This is very different to a technique that just takes data and processes it into a visual or physical form. It is not about numbers but about a model of generating shells that are qualitative, meaning producing and change making. It is about how a person could pick up a shell and begin to read their own meanings into it, knowing that it is generated from their own health data. Knowing that the subtle but strange variations in each shell indicate something to be explored in our lifestyles and behaviours.

This third generation of shells are moving further towards acquiring a ‘life’ of their own, becoming objects of meaning in the world. They are shaped by ‘lived constraints’ in the growth model and are getting expressions that go beyond pure mathematics.
I’m now working on a fourth generation of shells, this time using data posted on the internet using social media.
Newsletter July 2012
July 28, 2012 by admin
Its been over a year since we sent out our last newsletter – not that we haven’t been busy, in fact we’ve been absorbed in a whole range of projects and activities :
Storyweir at Exlab, Hive Beach, Dorset
We have been commissioned by Exlab to create a new project at Hive Beach, Dorset as part of the Cultural Olympiad. The work opens on Saturday 28th July and will remain on site until 9th September. We have 3 days of free talks and 2 nighttime events (projections with live cello) on Friday 3rd to Sunday 5th August – all welcome.
http://proboscis.org.uk/tag/storyweir/

++++++++++++++++++++
![]()
This October sees the launch of our new monthly publication – each month we will crowdsource, print and post out an eBook to subscribers created and shared on http://bookleteer.com sharing the most beautiful, experimental, thought-provoking and inspirational eBooks people have created to inspire and provoke others into creating more of their own.
SUBSCRIBE HERE : http://bookleteer.com/blog/2012/07/introducing-the-periodical/
++++++++++++++++++++
![]()
We’re also introducing a whole range of new features to http://bookleteer.com this year – public sharing, library pages as well as some exciting new developments later this year. Follow our progress here :
http://bookleteer.com/blog/category/updates-improvements/
We’ve also dropped the minimum print run for our Short Run printing service to just 25 copies per eBook and the prices for printing A6 eBooks have dropped between 30-50%. Check the prices with our estimator tool here:
http://bookleteer.com/blog/ppod/
++++++++++++++++++++
![]()
Proboscis have been collaborating with Royal Holloway’s Information Security Group (as part of the their EPSRC/ESRC/TSB research project Vome – http://www.vome.org.uk) to work with a local community in Pallion, Sunderland to create a sustainable knowledge and support network for local people to help each other cope and deal with benefit changes. We have developed a set of simple tools and processes to assist this “Ideas Exchange” – co-designed with the local community and are helping them integrate and adopt them into their ways of getting things done.
http://proboscis.org.uk/tag/pallion/
This Autumn we will be releasing a “Neighbourhood Ideas Exchange” package with versions of the tools that any community will be able to adopt and adapt for their own uses. Look out for announcements in September/October.
++++++++++++++++++++

Visualise Lifestreams
Proboscis has been commissioned by Futurecity and Arts&Business Cambridge to collaborate with Philips R&D in Cambridge as part of Anglia Ruskin University’s Visualise Public Art programme. We are exploring new forms for motivating people to incorporate health monitoring into their lifestyles by linking personal health data to systems that create tangible outputs. Starting with 3D printed ‘shells’ whose growth and shape is determined by data sets collected from ourselves, we plan to move on to feeding data to affect the growth of crystals and eventually towards ‘growing’ a shell organically through tissue engineering.
http://proboscis.org.uk/tag/lifestreams/
++++++++++++++++++++
Recent Publications

Professor Starling’s Thetford-London-Oxford Expedition
by Lisa Hirmer, Andrew Hunter, Josephine Mills, Leila Armstrong, Giles Lane and Hazem Tagiuri
Download Free : http://diffusion.org.uk/?p=2587
Buy a limited edition set : http://proboscis.org.uk/store.html#profstarling

Material Conditions
by Active Ingredient, Desperate Optimists, Jane Prophet, Janet Owen Driggs & Jules Rochielle, Karla Brunet, London Fieldworks, Ruth Maclennan, Sarah Butler
Download Free : http://diffusion.org.uk/?cat=1043
Buy a limited edition set : http://proboscis.org.uk/store.html#materialconditions

City As Material : London
Contributions by Tim Wright, Simon Pope, Ben Eastop & Alexandra Deschamps-Sonsino
Download Free : http://diffusion.org.uk/?cat=976
Buy a limited edition set : http://proboscis.org.uk/store.html#cityasmaterial1
Storyweir at Hive Beach, Dorset
July 25, 2012 by aliceangus


2nd generation of 3D printed Shells for Visualise
July 25, 2012 by stefankueppers
I have just come back from the Digital Manufacturing Centre 3D printing lab at UCL where we just had our second round of shells made for us.
This time around you can see shells which are beginning to have some life (or data to be exact) put in to them. They are ‘grown’ by using the health data we have previously collected from the body sensors and data logger which we are beginning to use to evolve different types, shapes and sizes of shell.

We captured the initial data over a week back in May which consisted of blood pressure, step counts, length of sleep, body temperature, exposure to air pollution and alcohol intake. These were gathered to provide a range of values we could use to make the shells change the way they are evolved over time.

These different dimensions of data are used in our growth model as parameters that influence where and how much the shell grows and in which particular way. Each set of data values contribute to determining how much it grows, how smooth or jagged the surfaces are and whether or not there are other outgrowths. All together this results in a very personalised and specific shape that is unique to each data set.

We are planning to fabricate two further sets of shells, one with more extensive data sets informing the shell growth pattern, and the second experimenting with different data sources. More posts to come!
Our growth model as mentioned before is using variants of ‘parametric design’ via L-Systems and Growth Grammars. Here is a very quick explanation of what these do in principle:
Parametric Design
In a parametric design different numerical values – called parameters – are put into a set of related mathematical formulas or rules. These are able to generate variations of shapes or objects based on different input values. It is for example possible to create a parametric definition of a basic chair that when combining the height and leg length of a person – can generate a chair with proportions that make it comfortable for that person to sit on. So a parametric design in this case captures the idea of a chair that can be made to fit different bodies – i.e. how many legs the chair has, the way the legs are connected to the seat area, the seat sitting area and the height position of the backrest.
L-Systems
These were invented by a man called Aristid Lindenmayer and are type of formal language that uses sequences of letters that define how something grows over several time periods. They can for example express how a tree expands from its trunk into branches and then into leaves or how a flower’s petals are arranged.
Growth Grammars
These are more complicated variations on L-Systems that have a richer set of features that can be used to describe growth models such as plant models. Growth Grammars are used in not just modelling the structure of plants i.e. how it is put together and its parts but also how it functions and its parts interact with each other.
1st generation of 3D printed Shells for Visualise
July 16, 2012 by stefankueppers

After what has been a broad exploratory research and foraging phase into shell morphology and modelling systems for our Visualise project, I have just picked up the first round of 3d printed shells which we had done at the Digital Manufacturing Centre @ UCL. Thanks to Martin and Richard for their assistance with the 3d printing process!
What you see here is a twist on classic plain formula driven generative shells that you may have seen before. We are experimenting with ways of adapting shell formation of our 3d shells based on data capture we have started in previous experiments in lifestyle and health data monitoring. I have been looking into a variety of generative modelling systems anywhere from those originating in the CAD world to those for plant modelling in the bio and agricultural sciences.

Now I have settled on using a growth grammar platform called XL (it builds on ideas of l-systems but with much more flexibility and dynamic rewriting of growth rules). The XL grammar is interesting as its been developed for plant morphological and systemic modelling, allowing the generative growth rules to be switched based on time variant environmental factors throughout growth cycles.
This offers some exciting possibilities of mimicking real-world feedback patterns of environmental constraints on living entities such as plants or other living systems giving rise to different possible ‘expressions’ based on the ‘quality of life’ over time they experience in their environment (e.g. through droughts, wet seasons, sparse or rich nutrition, pollution factors, over-shading, etc.).
The shells you see here are a variations of an evolving shell model that can be infused with our previous and ongoing environmental and personal data capture data sets (e.g. with readings such as daily step-count, blood pressure, sleep pattern regularity) to determine the evolving form.
Look out for further variations on these shells shortly!
a vision of the sea floor
July 15, 2012 by aliceangus
With under 2 weeks to go till the opening of Exlab I’m rushing to finish some parts of our commission and am working on outputting an image of the seafloor of the area by Hive Beach to then lasercut. Ive finally managed to get some workable images from the 2008 Bathymetric surveys (a kind of sonar scanning) of the geology of the seabed available on the Channel Coastal Observatory website and this image shows the Burton Beach area. Its an area swimmers have described as being difficult to swim through – the waves are unpredictable and you get stuck in it. I’m reliably informed by many people who live and work here that his part of the coast is pretty dangerous because the shingle slopes very steeply into the sea causing powerfull undertow under the waves.

We Are All Food Critics – The Reviews
July 6, 2012 by Giles Lane
One of the most fun things we’ve done this year has to be the little project we ran as part of the Soho Food Feast : helping some of the children of Soho Parish Primary School produce their own reviews of the amazing foods on offer in specially designed eNotebooks. The children would choose something from one of the many stalls, bring it to be photographed and a Polaroid PoGo photo sticker printed out an stuck into one of the eNotebooks, then they’d write about what the dish looked, smelt, felt, sounded and tasted like. This idea of doing the reviews through the 5 senses, along with the great introduction, was contributed by Fay Maschler, the restaurant critic of the London Evening Standard and one of the Food Feast committee members.
We’ve now published a compilation of the best reviews which is available via the Diffusion Library as downloadable eBooks and in the bookreader format. We’re also printing a short run edition which will go the children themselves (and a few for the school to sell to raise funds – get one while you can!). Thanks to everyone who took part in this project – the children of Soho Parish and Soho Youth, members of the Food Feast Committee (Anita Coppins, Wendy Cope, Clare Lynch), Rachel Earnshaw (Head Teacher) and the team here : Mandy Tang, Haz Tagiuri & Stefan Kueppers.